When you roll a fair die, the outcomes are 1 to 6. The probabilities of getting these outcomes are equally likely and that is the basis of a uniform distribution. Unlike Bernoulli Distribution, all the n number of possible outcomes of a uniform distribution are equally likely.
A variable X is said to be uniformly distributed if the density function is:
The graph of a uniform distribution curve looks like
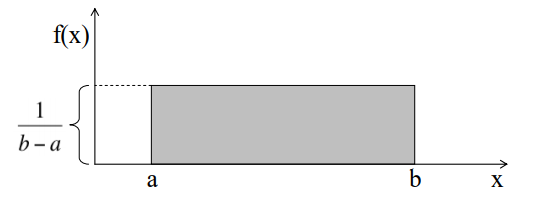
You can see that the shape of the Uniform distribution curve is rectangular, the reason why Uniform distribution is called rectangular distribution.
For a Uniform Distribution, a and b are the parameters.
The number of bouquets sold daily at a flower shop is uniformly distributed with a maximum of 40 and a minimum of 10.
Let’s try calculating the probability that the daily sales will fall between 15 and 30.
The probability that daily sales will fall between 15 and 30 is (30-15)*(1/(40-10)) = 0.5
Similarly, the probability that daily sales are greater than 20 is = 0.667
The mean and variance of X following a uniform distribution is:
Mean -> E(X) = (a+b)/2
Variance -> V(X) = (b-a)²/12
The standard uniform density has parameters a = 0 and b = 1, so the PDF for standard uniform density is given by:
No comments:
Post a Comment